To Export real-time Statistical Data for your Journey as a PDF Report, click the Reports tab at the top right of any screen in Which50. Find your Journey in the Journey list or search for your Journey in the searchbox.
Click on your Journey and you will be brought to the main Reports screen. Depending on the type of Journey you are viewing, you will see real-time percentage Statistics for the Journey including Sent, Delivered, Opened, Received, Visits stats etc. These Statistics can be refreshed at any time by clicking the Blue Refresh button at the top right of the screen.
Click into any of the items in your Journey to access both percentage and numerical Statistics. These Statistics can be refreshed at any time by clicking the Blue Refresh button at the top right of the screen.
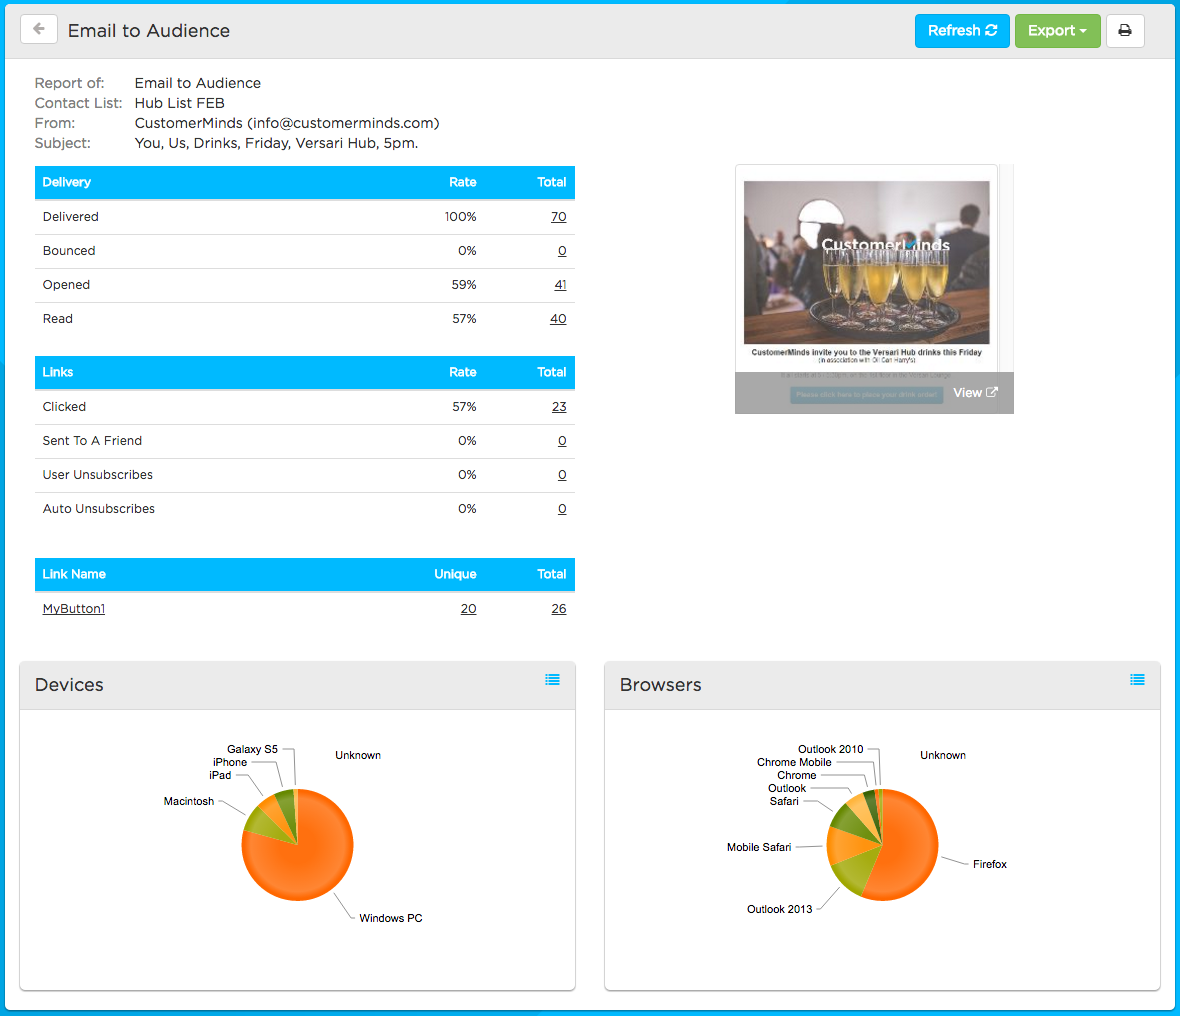
You will also see Statistics for any Links within your Journey, including both Unique and Total clicks. The figure for Unique is the amount of Individual User clicks. The figure for Total will include all Link clicks, for example if one Individual User clicked the same Link several times.
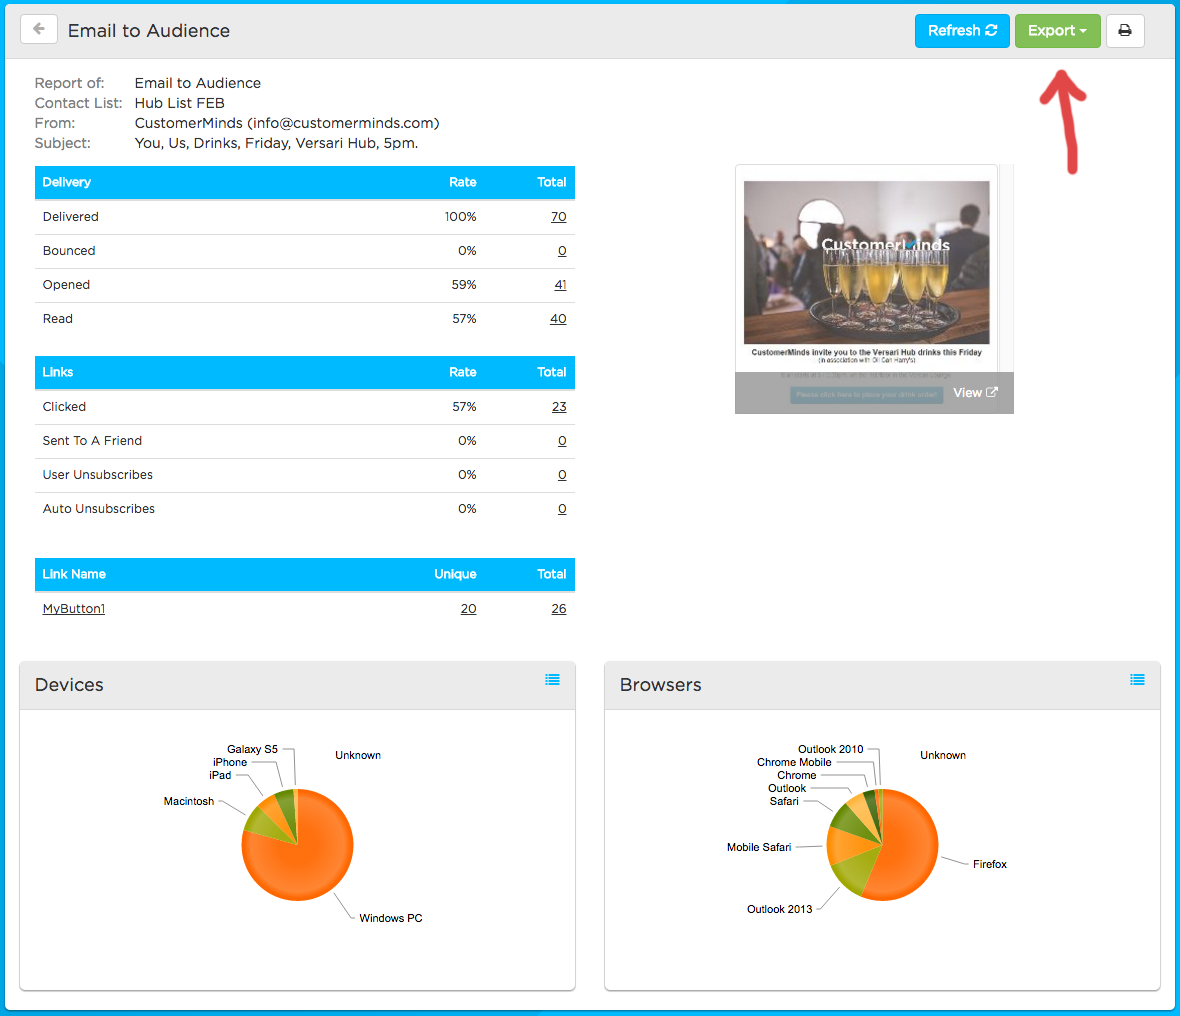
Click the Green Export button beside the Refresh button to Export a PDF Report of all the information on this screen. These PDF Reports are a quick and easy way to share Journey updates with your colleagues and other stakeholders. We’re sure your stats are looking great!
Comments